
6 AI Models Predict AppLovin (APP) Stock: A Comparative Market Analysis

Disclaimer: This article is for informational and educational purposes only. The predictions and analyses presented herein were generated by AI systems and should not be construed as financial advice, investment recommendations, or solicitations to buy or sell any securities. Stock prices are inherently unpredictable, and all investments carry risk of loss. Past performance does not guarantee future results. Readers should consult qualified financial advisors before making any investment decisions. TheDayAfterAI News and its contributors do not accept liability for any losses arising from reliance on this content.
Can artificial intelligence predict the stock market? At TheDayAfterAI News, we put six of the world’s leading AI chatbots to the test. We asked each one the same question: What will AppLovin Corporation (NASDAQ: APP) stock do over the next five trading days, from February 12 to February 19, 2026?
AppLovin presented a fascinating test case. On February 11, 2026, the company reported blockbuster Q4 2025 earnings — revenue of $1.66 billion (+66% YoY), an extraordinary 84% adjusted EBITDA margin, and Q1 2026 guidance above consensus. Yet in a classic “sell-the-news” reaction, the stock dropped 5–7% in after-hours trading, compounded by sector-wide software weakness, Google’s Genie 3 AI disruption narrative, and the looming January CPI report on February 13.
We tasked six chatbots — Google Gemini, OpenAI ChatGPT, xAI Grok, Perplexity, Anthropic Claude, and Microsoft Copilot — with providing their predicted opening price (Feb 12), predicted closing price (Feb 19), probability of price increase vs. decrease, and an estimated trading range for the period. Each AI was given the same baseline information and access to current market data. Here is what they said.


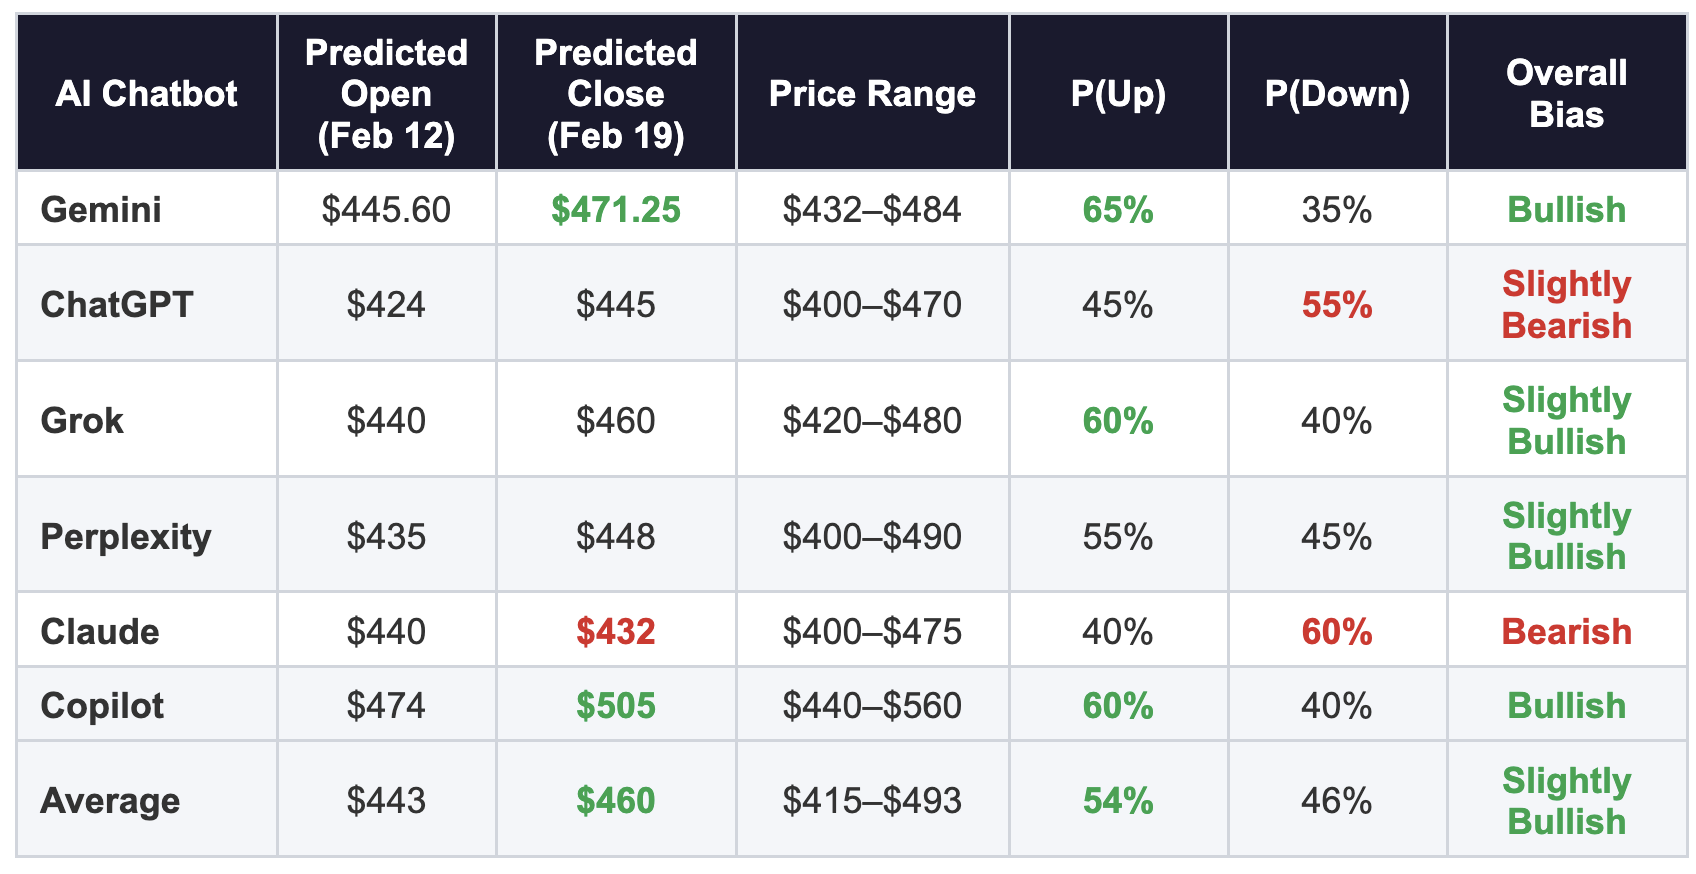
Head-to-Head Forecast Comparison
The table below summarises each AI’s core predictions for the five-day trading window. All prices are in USD.


What Each AI Said
Google Gemini — The Confident Bull
Gemini delivered the most detailed and structurally bullish analysis of the six. It framed the post-earnings pullback as a “tactical accumulation opportunity” within a structural uptrend, projecting a two-phase week: initial volatility and capitulation testing near $440–$450, followed by a recovery driven by value buyers and positive options-flow mechanics after the February 13 weekly expiration.
Gemini’s 55% base-case scenario (“Grind and Recover”) anticipated the stock finding a floor at the 50-day SMA around $431–$435, with post-holiday liquidity returning to push prices back toward $468–$475. The analysis included a sophisticated discussion of gamma squeeze potential, the divergence between February 13 and February 20 options max pain levels ($450 vs. $500), and the Google Genie 3 AI disruption narrative — which it ultimately dismissed as “noise” for the short-term window.
Verdict: Aggressive Buy on Dips to $432–$435, with a price target of $471.25 (+5.7% predicted return).
OpenAI ChatGPT — The Cautious Realist
ChatGPT took the most conservative opening price estimate at $424, anchored tightly to the pre-market print of ~$422. It assigned a slight downside skew (55% probability of net decrease) based on bearish momentum indicators (RSI ~43.7, negative MACD) and the risk of a hot CPI print amplifying the sell-off in high-multiple growth names.
The day-by-day path projected a gradual grind higher from $424 to $445 over five sessions, but with wide intraday ranges reflecting extreme implied volatility (~97%). ChatGPT’s statistical wide range (1-sigma) extended as low as $366, underscoring its emphasis on tail risk.
Verdict: Slightly bearish. Expects modest recovery but not enough to offset the gap-down from the Feb 11 close.
xAI Grok — The Balanced Pragmatist
Grok produced the most balanced analysis, landing squarely in the middle of the pack. It predicted a $440 open and a $460 close with a 60% probability of net increase. Its analysis emphasised the tension between strong fundamental support (analyst consensus Buy rating, average price target ~$682, 49% upside) and near-term technical headwinds (price below most moving averages, bearish options flow with 121K+ put contracts).
Grok’s day-by-day calendar was particularly useful, mapping specific catalysts (jobless claims Feb 12, CPI/PPI Feb 13, 20-Year Bond Auction Feb 18, trade balance Feb 19) to their potential impact on APP. It noted that macro factors were “mixed but unlikely to derail APP significantly.”
Verdict: Sideways-to-upward movement. Expects earnings digestion and dip-buying to support a modest recovery.
Perplexity — The Methodical Researcher
Perplexity delivered the most extensively sourced analysis (87 citations), structuring its response across six detailed analytical pillars: price action & technicals, options flow & positioning, market sentiment & breadth, fundamental catalysts, macroeconomics, and scenario planning. Its central estimate of $435 open to $448 close implied a modest +2–4% net gain.
A standout feature of Perplexity’s analysis was its careful handling of moving average data, noting that APP was trading below its 20-day ($505), 50-day ($608), and 200-day ($503) moving averages — a “textbook medium-term downtrend.” It gave the widest base-case range of the group ($400–$490) and was explicit that these were “scenario estimates, not precise forecasts.”
Verdict: Slightly bullish with high uncertainty. The most research-heavy and well-cited of all six analyses.
Anthropic Claude — The Contrarian Bear
Claude was the lone outright bear in the group, predicting a closing price of $432 on February 19 — lower than its predicted $440 opening price — and assigning a 60% probability of net decrease. It framed AppLovin as “fundamentally the strongest it has ever been” but “technically weakened and sentiment-damaged,” emphasising that excellent earnings being punished was itself a bearish signal.
Claude’s analysis was distinctive in its focus on competitive threats: CloudX’s LLM agent-based tools (which triggered a 16% single-day decline), Google’s Project Genie, the SEC investigation into “identifier bridging” data practices, and the broader “SaaSpocalypse” narrative. It also highlighted the FOMC minutes (Feb 18) and US-Iran geopolitical tensions as additional risk factors that other AIs largely overlooked.
Verdict: Bearish. The safest prediction is “continued turbulence” with a slight downward drift. Notably, Claude assigned the lowest confidence level (20–25%).
Microsoft Copilot — The Outlier Optimist
Copilot was the clear outlier, projecting the highest opening price ($474), the highest closing price ($505), and the widest upper range ($560). Its opening estimate appears anchored to a different pre-market observation point than the other five AIs, which all referenced pre-market prints in the $417–$440 range. Copilot cited ~$474 as the pre-market level.
The day-by-day forecast showed a steady climb from $474 to $505, driven by short-covering, residual post-earnings digestion, and institutional flows. While it acknowledged downside risks (sector weakness, insider selling), its overall analysis was the most structurally optimistic.
Verdict: Firmly bullish. However, the significantly higher opening price anchor raises questions about data consistency compared to the other five models.


Universal Agreement
Fundamentals are strong: All six AIs acknowledged that APP’s Q4 2025 earnings were exceptional (84% EBITDA margin, 66% revenue growth, above-consensus Q1 guidance).
CPI is the key macro catalyst: Every analysis identified the January CPI report (February 13) as the single biggest external risk factor for the period.
High volatility is guaranteed: All six projected wide intraday ranges (8–10%+ daily swings possible), reflecting implied volatility near ~95%.
Presidents’ Day liquidity gap: All noted that the market closure on Monday, February 16 would create de-risking pressure on Friday and potential pent-up flows on Tuesday.
Options expiration dynamics matter: Five of six AIs discussed the Feb 13 weekly options max pain at ~$450 and its gravitational effect on price action.


Key Disagreements
Directional conviction: Four AIs leaned bullish (Gemini, Grok, Perplexity, Copilot), one was mildly bearish (ChatGPT), and one was outright bearish (Claude).
Opening price anchoring: Opening estimates ranged from $424 (ChatGPT) to $474 (Copilot) — a $50 spread that reflects different pre-market data snapshots and interpretation methodologies.
AI disruption weighting: Gemini dismissed the Google Genie narrative as “noise”; Claude treated it as a material risk factor. This divergence reflects a fundamental disagreement about how to weight long-term existential risks in a 5-day forecast.


Editorial Observations
Several patterns emerged from this exercise that are worth highlighting for readers evaluating AI-generated financial analysis:
Data anchoring matters enormously. The $50 spread in opening price estimates (ChatGPT at $424 vs. Copilot at $474) demonstrates that pre-market data snapshots taken even minutes apart during volatile sessions can produce radically different starting points — and therefore different trajectories.
Depth varies wildly. Gemini’s 16-page report with 38 citations and Perplexity’s 17-page analysis with 87 citations stand in stark contrast to Copilot’s 3-page summary. However, more detail does not necessarily mean better predictions — this is something only actual market outcomes can verify.
Risk framing reveals AI personality. Claude’s deliberate assignment of low confidence (20–25%) and its focus on tail risks (geopolitical tensions, SEC investigations) reflects a more cautious, risk-aware analytical style. Gemini’s “Aggressive Buy on Dips” recommendation reflects a more conviction-driven approach. Neither is inherently superior — they serve different investor profiles.
None of these are investment advice. Every AI included some form of disclaimer. Short-term stock prediction remains extraordinarily difficult, and AI models are synthesising publicly available information — they have no edge on insider knowledge or real-time order flow. Treat these as scenario frameworks, not trade signals.
The divergence is stark. ChatGPT envisioned a steady recovery from the gap-down open, with each subsequent session closing higher as oversold conditions attracted dip buyers. Gemini, by contrast, modelled a “lower highs, lower lows” trajectory, with the CPI release on Friday 13 February acting as an inflection point that accelerated selling into the long weekend. Grok projected a similar declining pattern with a modest bounce on the final day.


License This Article


We are a leading AI-focused digital news platform, combining AI-generated reporting with human editorial oversight. By aggregating and synthesizing the latest developments in AI — spanning innovation, technology, ethics, policy and business — we deliver timely, accurate and thought-provoking content.