
Can AI Predict Stocks? Comparing 6 Chatbot Forecasts for Credo Technology (CRDO)

Disclaimer: This article is for informational and educational purposes only. The predictions and analyses presented herein were generated by AI systems and should not be construed as financial advice, investment recommendations, or solicitations to buy or sell any securities. Stock prices are inherently unpredictable, and all investments carry risk of loss. Past performance does not guarantee future results. Readers should consult qualified financial advisors before making any investment decisions. TheDayAfterAI News and its contributors do not accept liability for any losses arising from reliance on this content.
Can artificial intelligence predict the stock market? At TheDayAfterAI News, we decided to put this question to the test in a unique experiment. We presented the same analytical challenge to six of the most widely used AI chatbots and compared their forecasts head-to-head.
The subject: Credo Technology Group Holding Ltd (NASDAQ: CRDO), a semiconductor connectivity company that had just dropped a blockbuster preliminary revenue announcement on February 9, 2026. With Q3 FY2026 revenue coming in at $404–$408 million — roughly 19% above guidance and far exceeding the $341 million analyst consensus — the stock gapped up over 15% in after-hours trading.
We asked each chatbot the same question: What will CRDO’s stock price do over the next five trading days (February 10–17, 2026)? Each was asked to provide a predicted opening price for February 10, a predicted closing price for February 17, a probability assessment of price increase versus decrease, and an estimated trading range for the period.
The six AI chatbots we tested were Gemini (Google), ChatGPT (OpenAI), Grok (xAI), Perplexity, Claude (Anthropic), and Copilot (Microsoft). What follows is a detailed comparison of their forecasts, methodologies, areas of agreement, and the striking differences that emerged.


What Every Chatbot Agreed On
Before examining where the chatbots diverged, it is worth noting the remarkable consensus on the fundamental backdrop. All six platforms identified the same core catalyst and agreed on several key facts.
The revenue beat was extraordinary. Credo’s preliminary Q3 FY2026 revenue of $404–$408 million crushed both its own guidance ($335–$345 million) and Wall Street consensus (~$341 million). Every chatbot recognised this as a material positive event driven by accelerating demand for Active Electrical Cables (AECs) in AI data centre infrastructure.
All six also identified the same macroeconomic risk events during the forecast period, particularly the CPI data release (which various chatbots placed on either February 11 or 13, reflecting slightly different economic calendar assumptions), and the Presidents’ Day market closure on February 16 reducing the week to five trading sessions. The analyst consensus was universally described as overwhelmingly bullish, with 15 Buy ratings, price targets ranging from $198 to $227 on average, and Needham maintaining a $220 target.


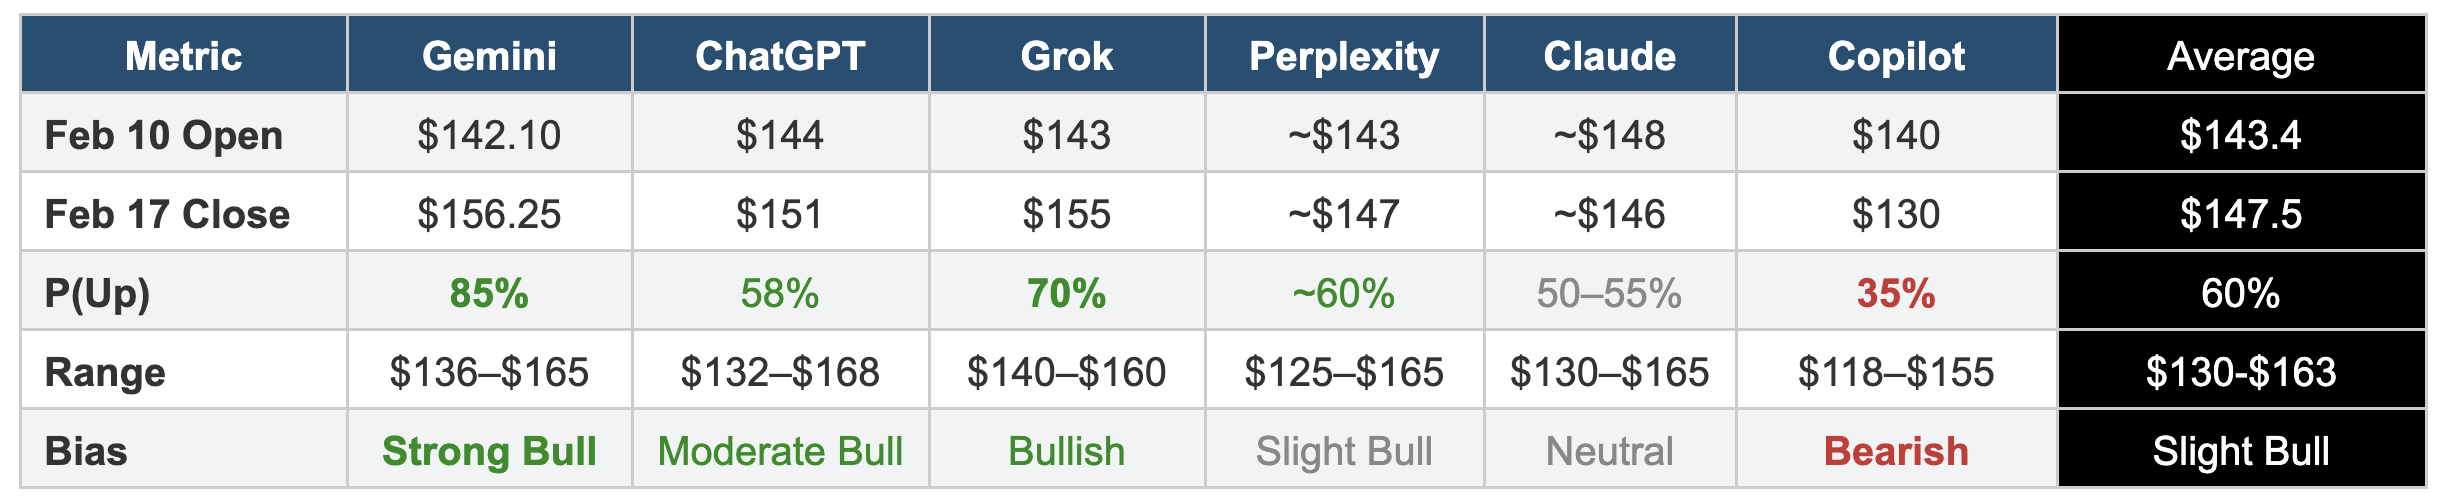
The Forecasts at a Glance
The table below presents the core predictions from each chatbot side by side. The differences are immediately apparent.


Individual Chatbot Analysis
1. Gemini (Google) — The Strongest Bull
Gemini delivered the most detailed and most bullish report of the six, framing its analysis as an institutional-grade equity research report. It projected CRDO opening at $142.10 on February 10 and closing at $156.25 on February 17, assigning an 85% probability to a positive weekly return.
What set Gemini apart was its level of granularity. It provided a detailed day-by-day forecast with specific price targets for each session, incorporated options market mechanics such as gamma squeeze dynamics and IV crush analysis, and modelled three distinct CPI scenarios with their respective impacts on CRDO. It also discussed the Astera Labs correlation (0.75 coefficient), the Cisco Silicon One G300 as sector validation, and detailed short squeeze mechanics.
Gemini’s projected trading range of $136–$165 was among the tighter ranges, reflecting its confidence in bullish continuation. The report’s weakness was arguably its conviction level — an 85% probability of upside after a 15% gap-up is a bold call that may underweight the historical tendency of large gaps to partially fill.
2. ChatGPT (OpenAI) — The Measured Pragmatist
ChatGPT struck a moderate tone, projecting an opening near $144 and a closing price of $151 on February 17. It assigned a 58% probability to an upside close, making it the second-most cautious of the bullish forecasters.
The analysis distinguished itself through its explicit scenario framework: a bull case (~30% probability, $150–$175), a base case (~45%, $138–$165), and a bear case (~25%, $125–$145). This probabilistic structure acknowledged the inherent uncertainty more directly than some competitors. ChatGPT’s day-by-day estimates were presented as “central estimates with likely intraday bands,” showing a measured approach to forecasting a high-volatility name.
ChatGPT was also notably cautious about macroeconomic sensitivity, flagging that rates and QQQ correlation could dominate individual stock dynamics on any given day.
3. Grok (xAI) — The Fundamentals-First Analyst
Grok produced the most methodical analysis of the six, organising its findings across technical analysis, sentiment and positioning, fundamental catalysts, macroeconomic factors, and external influences. It predicted an opening price of $143 and a Feb 17 close of $155, with a 70% probability of a net price increase.
Grok’s standout feature was its structured data presentation, including tables for sentiment metrics (VIX at 18, put/call ratio at 0.60, short interest at 4.83%), technical indicators (RSI at 55, MACD bullish crossover), and catalyst impact assessments. The analysis noted that the estimated trading range of $140–$160 was the tightest of all six forecasters, suggesting high confidence in a relatively narrow consolidation band above the gap.
One notable observation: Grok placed the CPI release on February 11 rather than February 13, and referenced an Employment Cost Index release on February 10 — a different macro calendar interpretation from other chatbots.
4. Perplexity — The Data-Heavy Realist
Perplexity produced the most extensively sourced report, citing over 70 references across financial data platforms. It projected an opening of approximately $143 and a closing price of $147 on February 17, with a 60% probability of a net increase — positioning it in the cautiously bullish camp.
What distinguished Perplexity was its statistical rigour. It calculated one-week 1-sigma volatility at ±13% and derived explicit probability bands: a base-case range of $125–$165 and a tail-risk range of $110–$175. It was the only chatbot to explicitly discuss beta-adjusted volatility scaling (√time methodology) and provide 2-sigma tail risk estimates.
Perplexity was also unique in flagging recent insider selling as a concrete risk factor, noting a 7.2% down day triggered by insider transactions in late January. This added a layer of caution absent from most other analyses.
5. Claude (Anthropic) — The Cautious Contrarian
Claude’s analysis was the most explicitly cautious of the group, with a predicted opening of approximately $148 and a closing price of $146 on February 17 — implying the stock would essentially be flat to slightly down over the period. It assigned only a 50–55% probability of a net price increase, the lowest among the bullish-to-neutral forecasters.
Claude stood out through its detailed scenario analysis framework (bull 25–30%, base 40–45%, bear 25–30%) and its emphasis on “gap-and-fade” risk. It was the only chatbot to explicitly note that much of the upside may already be priced into the gap-up open, making the relevant comparison not the prior close but the elevated opening price. Its day-by-day directional estimates included a confidence level for each day, with “highly uncertain” assigned to the CPI day and “low” confidence for the post-holiday Tuesday.
Claude also provided the most granular risk matrix, scoring ten distinct factors (from the revenue preannouncement to VIX levels and February seasonality) by direction, weight, and impact level.
6. Copilot (Microsoft) — The Lone Bear
Copilot was the clear outlier, projecting a dramatic decline from an opening of $140 on February 10 to a close of $130 on February 17. It assigned a 65% probability that the stock would end the period lower than it opened — making it the only chatbot to predict a net decline.
Copilot’s bearish thesis rested on the argument that while the fundamental catalyst was genuinely positive, the resultant gap-up created a high-volatility environment with limited short-covering fuel to sustain a multi-day rally. Its day-by-day path projected a progressive retracement: $138 close on Day 1, $132 on Day 2, $128 on Day 3, $125 on Day 4 (Friday), before a modest bounce to $130 on the post-holiday Tuesday.
The analysis weighted market structure and liquidity factors (-15% bearish from the Presidents’ Day holiday) and mean reversion risk (-10%) as significant counterweights to the +40% bullish weight from the fundamental catalyst. While this was the most contrarian view, Copilot’s wide tail-risk range ($110–$155 on the upside) acknowledged the possibility of being wrong.


Key Themes and Divergences
The Bull-Bear Spectrum
The most striking observation from this experiment is the enormous spread in directional conviction. Gemini’s 85% upside probability and Copilot’s 65% downside probability represent fundamentally incompatible views of the same dataset. This 50-percentage-point gap illustrates how differently AI models weigh competing factors when forced to make a directional call.
The spectrum can be organised as follows: Gemini (strong bull) → Grok (bullish) → Perplexity (cautiously bullish) → ChatGPT (moderately bullish) → Claude (neutral) → Copilot (bearish). This suggests that the more weight a model gives to mean-reversion risk and post-gap price dynamics, the less bullish its forecast becomes.
The “Gap-and-Fade” Debate
The central analytical disagreement across all six reports was whether the massive gap-up would be sustained or would partially reverse. Gemini argued that “breakaway gaps” in high-momentum stocks rarely fill immediately, while Copilot treated the gap as a textbook setup for mean reversion. Claude and Perplexity acknowledged both possibilities but leaned toward the view that most of the good news was already priced in at the opening bell.
This debate mirrors a genuine tension in technical analysis. Academic research is mixed on gap-fill probabilities, with outcomes varying significantly by the magnitude of the fundamental catalyst and the prevailing market regime.
Methodology Differences
Each chatbot brought a distinct analytical personality to the task. Gemini functioned as a sell-side equity research analyst, complete with DCF framework references and institutional flow analysis. Perplexity behaved as a quantitative analyst, emphasising statistical distributions and volatility modelling. Claude operated as a risk manager, cataloguing failure modes and uncertainty levels. Copilot played the role of a contrarian trader, focusing on market microstructure and liquidity dynamics.
These differences likely reflect both the models’ training data biases and their architectural approaches to uncertainty. Models that are more conservative in expressing confidence (Claude, Perplexity) produced narrower implied returns, while models that lean into narrative conviction (Gemini, Grok) produced stronger directional calls.
The average consensus suggests a modest bullish bias, with an expected gain of roughly 3% from the opening price to the week-ending close. However, the extreme width of the range — from Copilot’s $130 bear case to Gemini’s $156 bull case — underscores the fundamental uncertainty inherent in short-term stock forecasting, even when the underlying fundamental catalyst is unambiguously positive.


What This Experiment Reveals About AI-Powered Financial Analysis
This comparison exercise yields several insights that extend beyond the specific CRDO forecast.
First, AI chatbots can produce remarkably sophisticated financial analysis. All six reports demonstrated understanding of options mechanics, macroeconomic transmission channels, technical analysis patterns, and institutional positioning. The quality of analysis from all six would be considered professional-grade by most retail investors.
Second, the same data produces wildly different conclusions. A 50-percentage-point spread in directional probability from the same fundamental inputs is a powerful reminder that forecasting is as much about analytical framework and weighting of competing factors as it is about data access.
Third, no AI chatbot should be treated as an oracle. Each model has embedded biases — whether toward narrative conviction, statistical conservatism, or contrarian positioning. These biases are features of how the models were trained, not bugs, but they mean that any single AI forecast should be consumed as one input among many.
Fourth, the ensemble approach has value. By aggregating across six different models, we can construct a more robust view that captures the range of plausible outcomes. The consensus average (~60% upside probability, ~$147 closing price) may prove more reliable than any individual extreme forecast.


License This Article


We are a leading AI-focused digital news platform, combining AI-generated reporting with human editorial oversight. By aggregating and synthesizing the latest developments in AI — spanning innovation, technology, ethics, policy and business — we deliver timely, accurate and thought-provoking content.