
Amazon Stock Forecast: 6 AI Chatbots Analyze the $200B "Capex Shock"

Disclaimer: This article is for informational and educational purposes only. The predictions and analyses presented herein were generated by AI systems and should not be construed as financial advice, investment recommendations, or solicitations to buy or sell any securities. Stock prices are inherently unpredictable, and all investments carry risk of loss. Past performance does not guarantee future results. Readers should consult qualified financial advisors before making any investment decisions. TheDayAfterAI News and its contributors do not accept liability for any losses arising from reliance on this content.
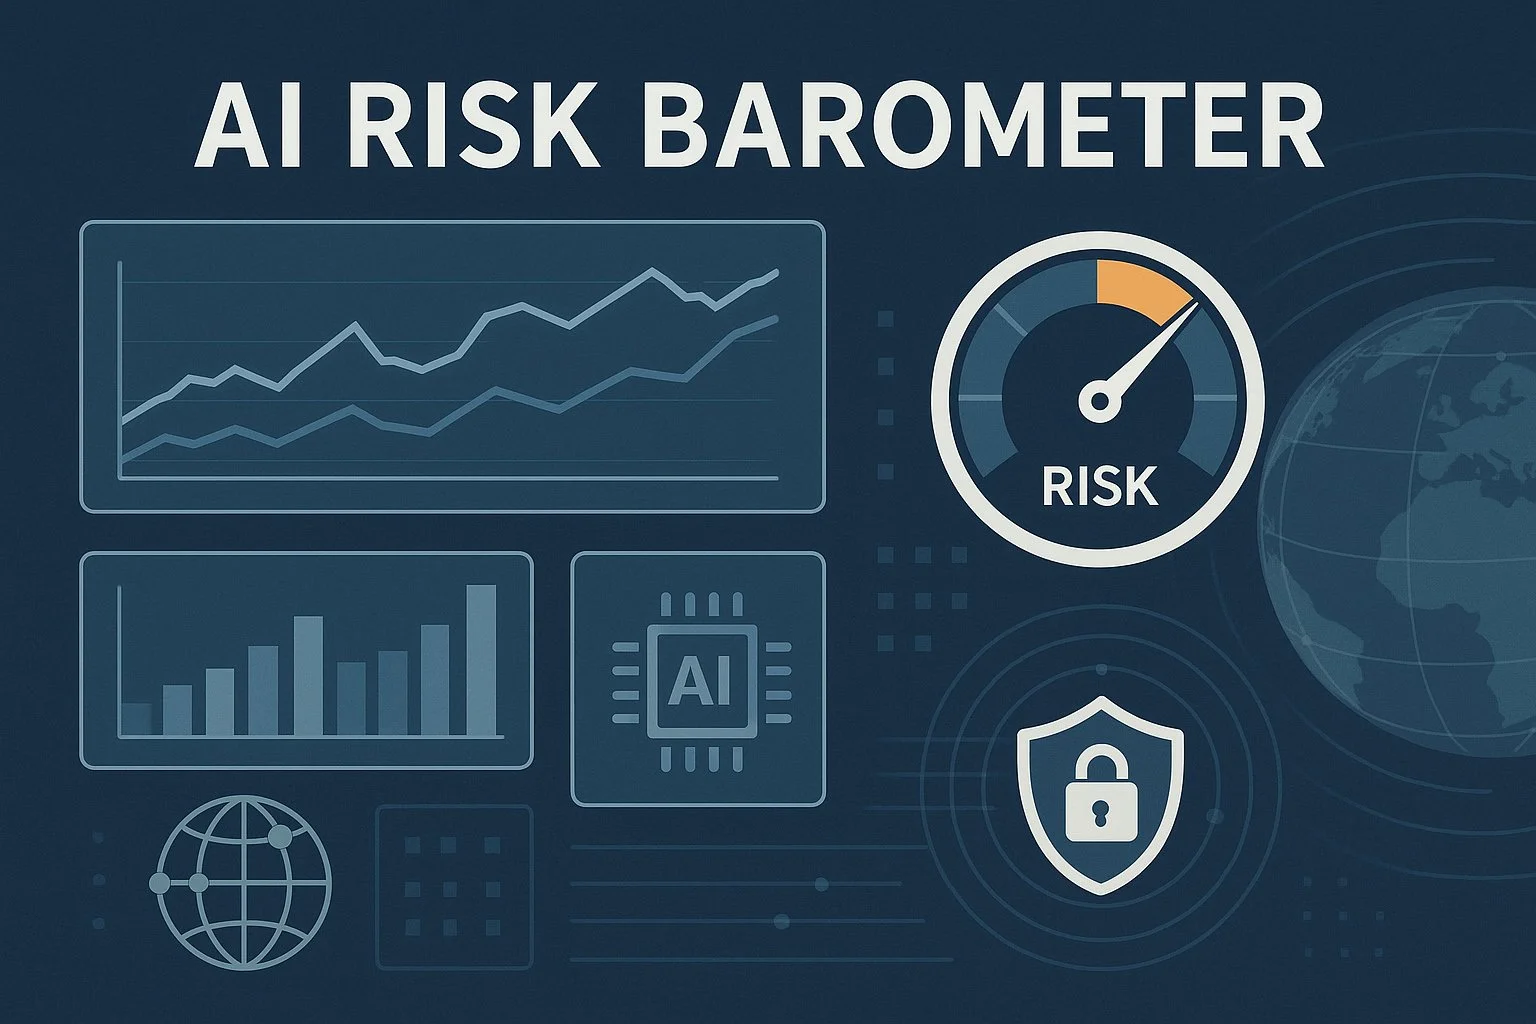
At TheDayAfterAI News, we believe the best way to understand how AI is reshaping financial analysis is to put it to the test. In this instalment of our AI Chatbot Stock Forecast Series, we gave the same assignment to six of the most widely used AI chatbots: predict Amazon.com Inc. (AMZN) stock price movement over five trading days, from February 6 to February 12, 2026.
Each chatbot was provided with the same prompt and had access to its own web-search capabilities to gather real-time market data, technical indicators, earnings reports, and macroeconomic information. The goal was not to provide financial advice, but to compare the analytical approaches, depth of reasoning, and predictive outputs from each AI system.
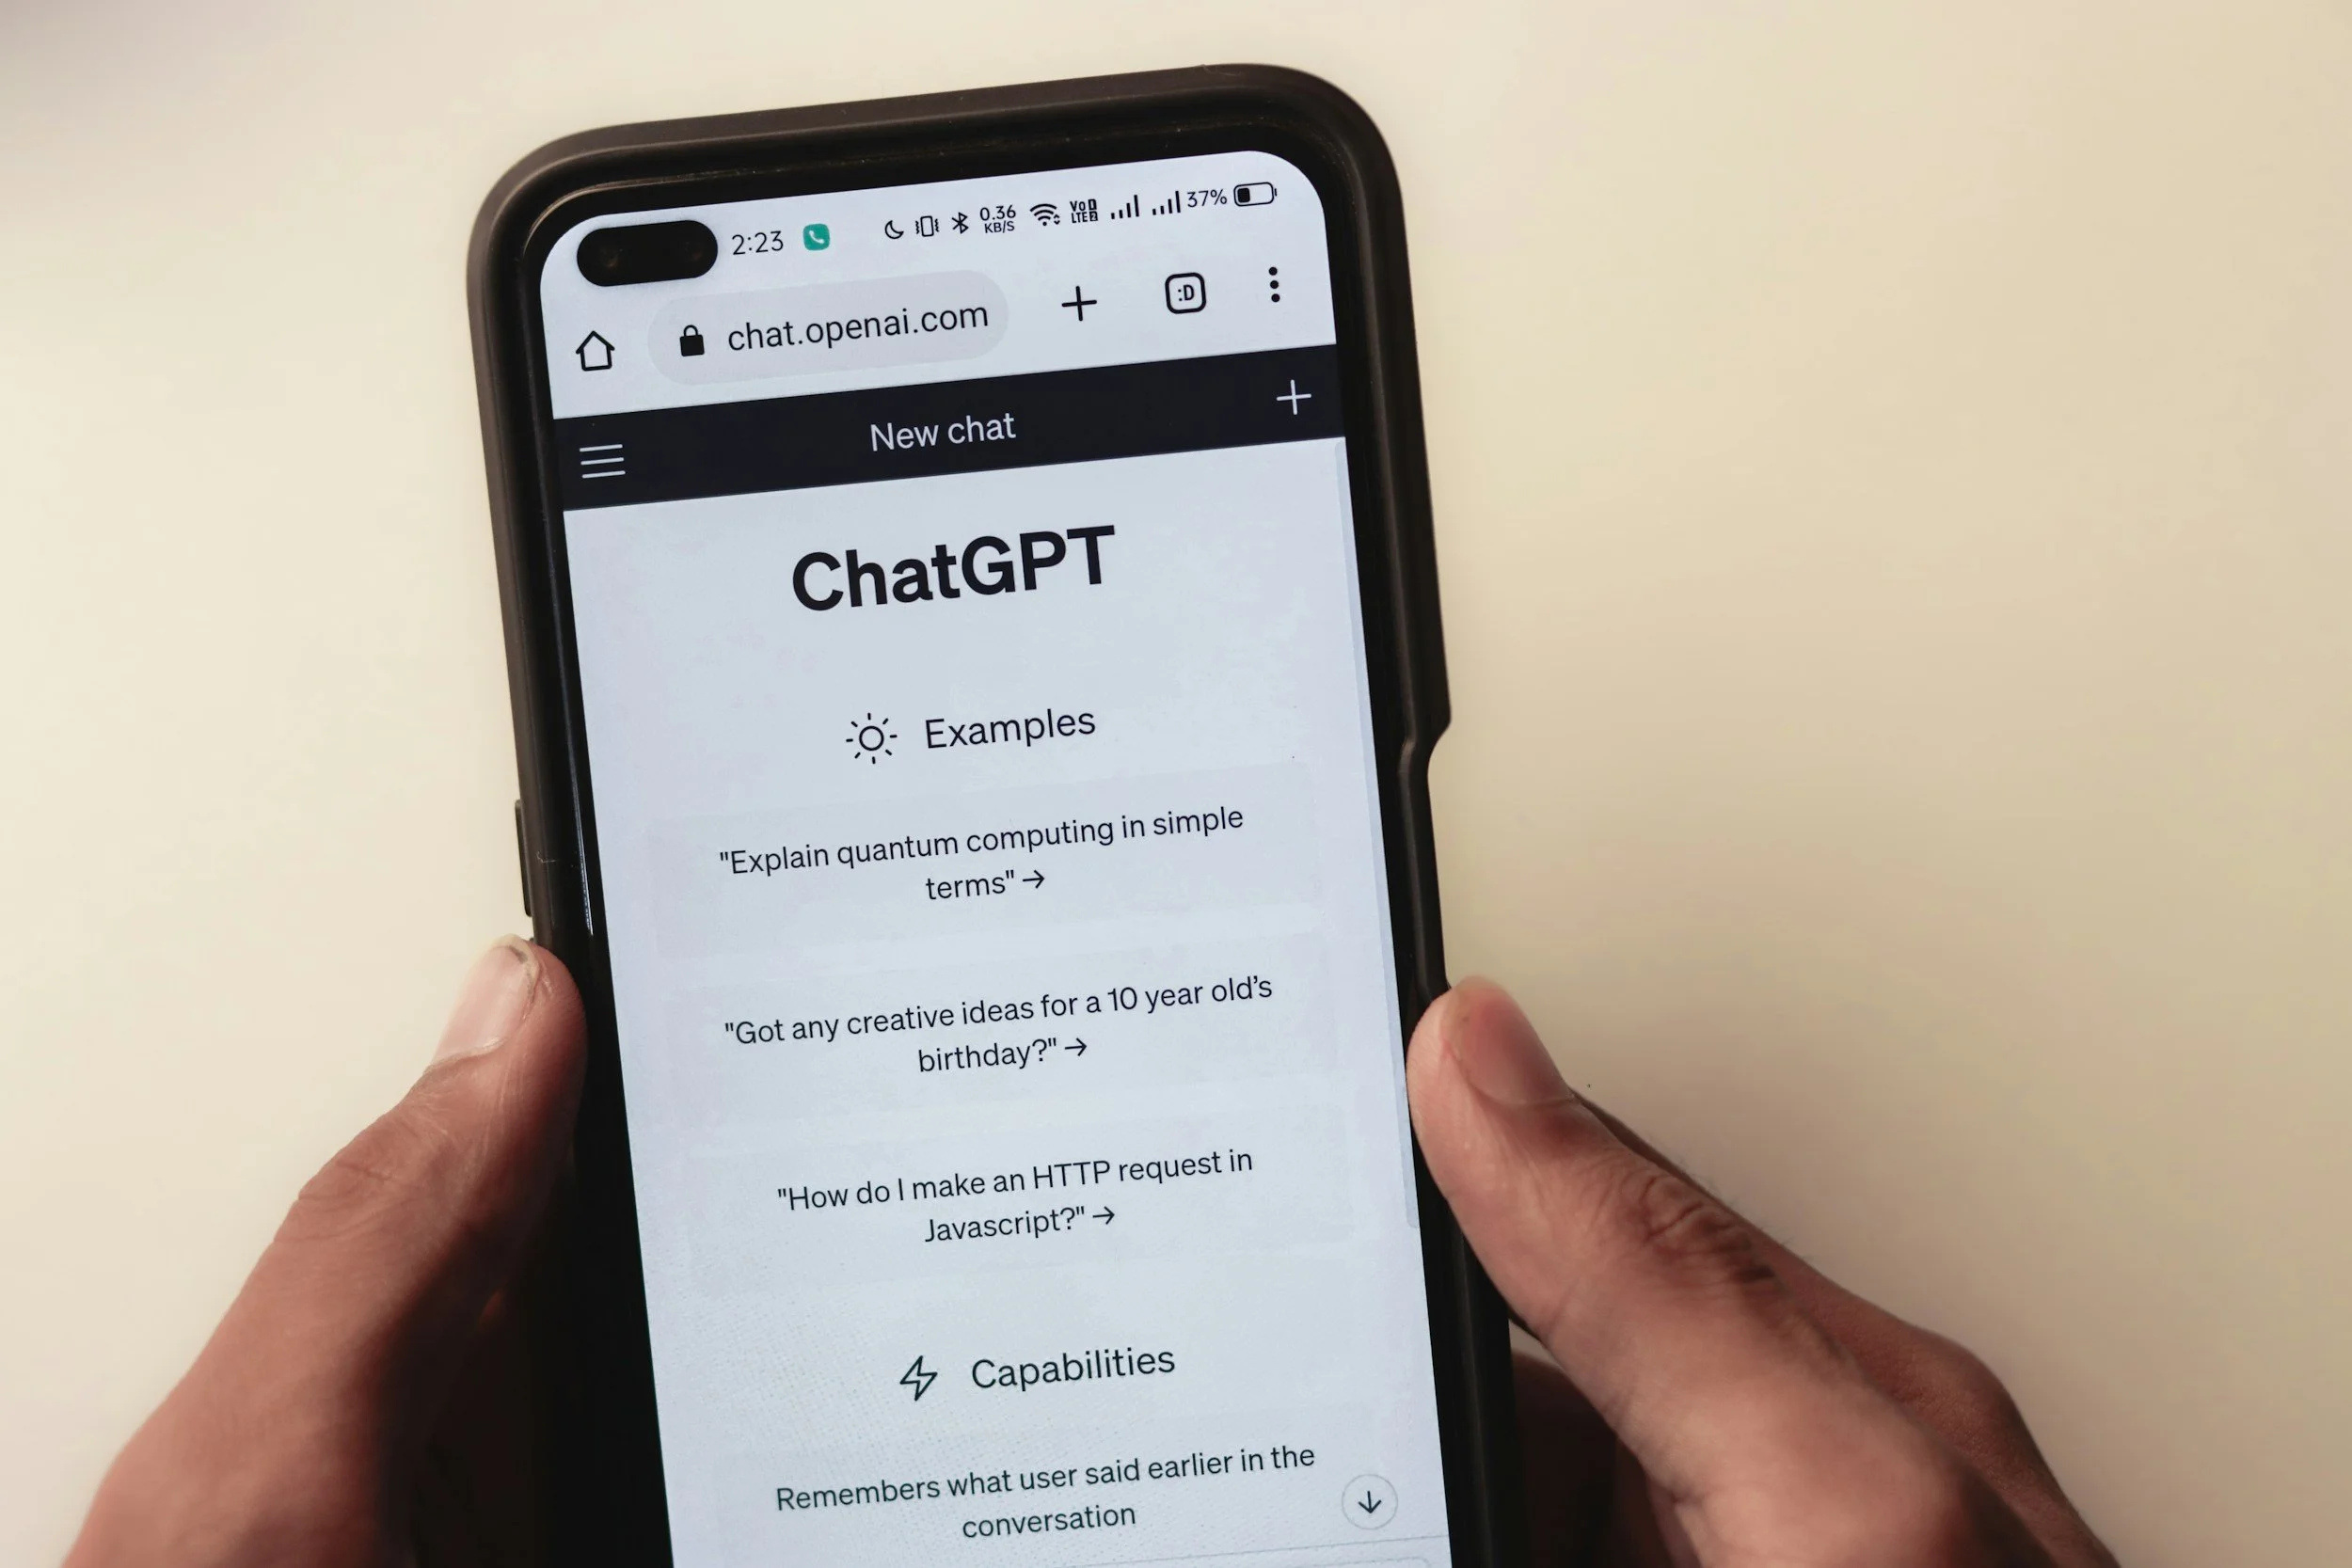
The six chatbots tested are: Gemini (Google), Claude (Anthropic), ChatGPT (OpenAI), Perplexity, Grok (xAI), and Copilot (Microsoft). Each returned detailed analyses spanning technical analysis, options flow, macroeconomic factors, and sentiment indicators.


Amazon’s “Capex Shock”
On February 5, 2026, Amazon reported Q4 2025 earnings after market close. Revenue of $213.4 billion (+14% YoY) beat consensus expectations, and AWS delivered impressive 24% year-over-year growth to $35.6 billion. However, these strong operational results were completely overshadowed by a single figure that sent shockwaves through the market: Amazon guided for $200 billion in capital expenditures for fiscal 2026, far exceeding the $146.6 billion analyst consensus.
The stock, which closed at $222.69 on February 5, cratered to approximately $198–$204 in after-hours and pre-market trading — a total decline of roughly 10–14% from the pre-earnings level. This massive post-earnings gap became the dominant analytical challenge for all six AI chatbots.
Adding to the complexity, several macro headwinds coincided with the forecast period: a partial U.S. government shutdown had delayed key economic releases including the January NFP report; CPI data was scheduled for mid-week; the VIX had spiked above 20 indicating elevated market fear; and a broader rotation out of high-capex tech names was underway across the Magnificent 7.


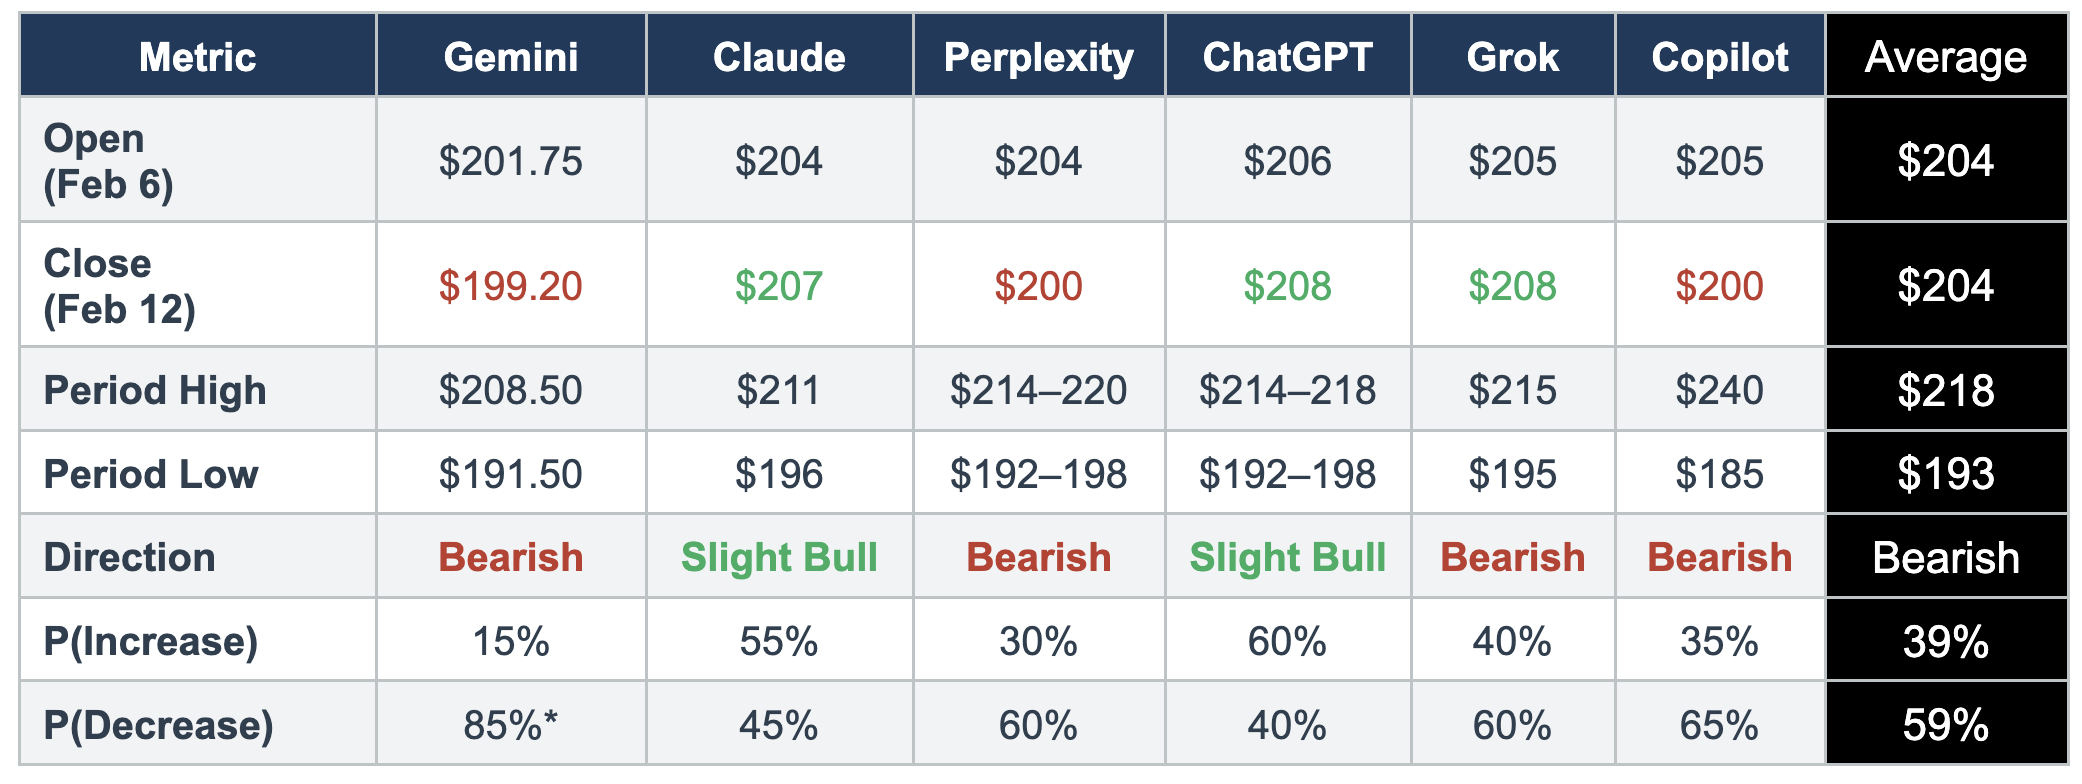
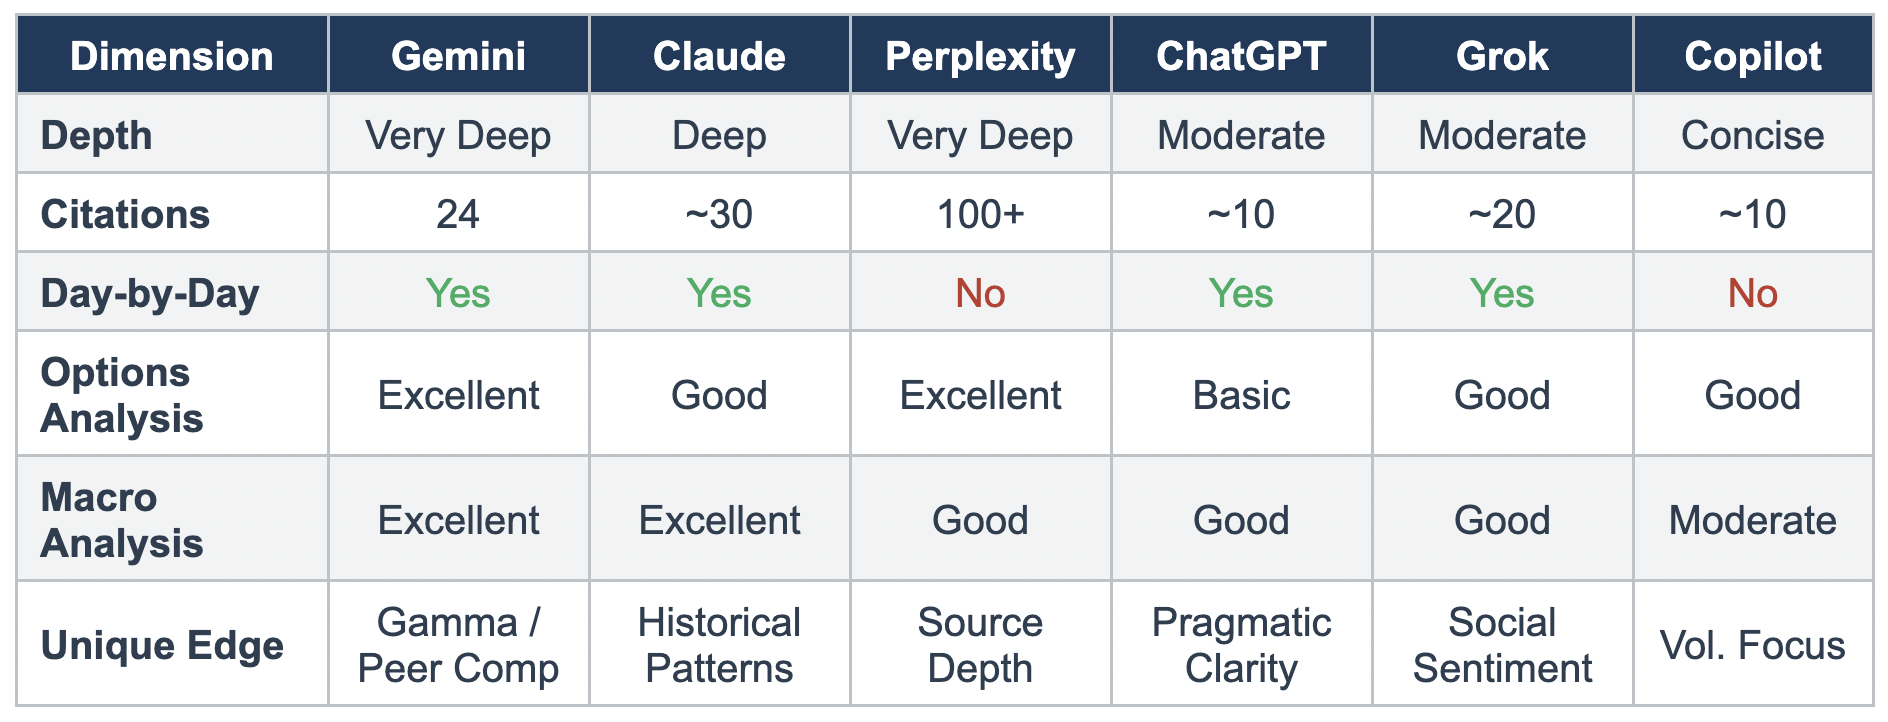
Head-to-Head: Forecast Summary
The table below presents the core numerical predictions from each chatbot, providing a snapshot comparison before we dive into the analytical details.


Where They Agree
Despite their differing conclusions on direction, all six chatbots converged on several key points. Every model identified Amazon’s $200 billion capex guidance as the dominant short-term catalyst, overshadowing the otherwise solid Q4 revenue and AWS growth figures. All six projected an opening price in the $201–$206 range, reflecting the roughly 8–10% pre-market gap down that was already observable in real-time trading data.
The chatbots universally flagged deep oversold technical conditions (RSI in the low 30s or below), broken moving average structures with price trading below all major SMAs, and elevated implied volatility in the options market. They also agreed that the $190–$200 zone represented meaningful technical support, and that the $210–$222 overhead gap would act as formidable resistance, effectively capping any recovery attempts during the five-day window.


Where They Diverge
The most significant divergence was on directional outlook. Four of the six chatbots — Gemini, Perplexity, Grok, and Copilot — predicted a net decline over the period, while Claude and ChatGPT leaned cautiously bullish, expecting a modest oversold bounce to dominate by week’s end. Gemini was the most bearish, projecting a close of $199.20 with an 85% implied probability of decline. ChatGPT was the most optimistic, forecasting a close of $208 with 60% probability of increase.
Copilot stood out as the outlier on range estimation, projecting a remarkably wide intraperiod high of $240 and low of $185 — a $55 spread — compared to the much tighter ranges of $15–$25 estimated by the other models. This may reflect either a different approach to probability distribution or less precision in calibrating short-term trading ranges.


Individual Chatbot Analysis
1. Gemini — The Deep-Dive Bear
Gemini delivered the most extensive and granular analysis of the six, spanning options gamma exposure mechanics, dealer hedging dynamics, fractal gap analysis, and macroeconomic policy risk from the Kevin Warsh Fed nomination. Its 11-page report employed sophisticated financial jargon and constructed three detailed probability-weighted scenarios: a “Capitulation & V-Bottom” at 15% probability, a “Slow Bleed / Consolidation” at 60%, and a “Macro Flush” at 25%.
Gemini’s key differentiator was its deep dive into options market microstructure, identifying a “Put Wall” at $190 and a “Gamma Wall” at $210 that would create a capped trading range. It was also the only chatbot to provide a comparative factor analysis table against Microsoft and Alphabet, contextualising Amazon’s position within the broader Magnificent 7 rotation. Its bearish conviction was the strongest of the group, projecting a close below the psychologically significant $200 level.
2. Claude — The Calibrated Optimist
Claude produced a detailed, well-structured analysis that balanced bearish technical damage against statistical tendencies for mega-cap stocks to partially recover within five days of a large post-earnings gap. It offered a complete day-by-day price projection and was distinctive in quantifying the impact of the government shutdown on the macro calendar — arguing that the delay of NFP and likely delay of CPI actually removed key volatility catalysts, paradoxically supporting stabilisation.
Claude’s 55/45 bullish-to-bearish split was the most balanced probability assignment, and its analysis of historical patterns for 10%+ post-earnings gaps in mega-caps (showing 50–55% partial recovery within 5 days) provided empirical grounding for its cautiously optimistic stance.
3. Perplexity — The Methodical Synthesiser
Perplexity delivered the most systematically referenced analysis, with over 100 cited sources spanning options data, technical analysis platforms, macroeconomic calendars, and institutional flow data. Its 13-page report organised findings into clearly delineated sections covering technicals, options flow, sentiment, fundamentals, and macro events.
Perplexity’s standout contribution was its granular treatment of options microstructure, noting AMZN’s implied volatility at 58% with an IV rank of 84.6%, and identifying dense weekly expiration dates (Feb 6, 9, 11, and 13) that would amplify intraday swings. Its 60/30/10 probability split (decrease/increase/flat) was the most detailed three-way breakdown offered by any chatbot.
4. ChatGPT — The Pragmatic Stabiliser
ChatGPT offered the most concise analysis, delivered in a structured three-page format with a clean day-by-day table and three scenario weights (Bear 40%, Base 45%, Bull 15%). Its approach was notably practical — anchoring predictions directly to observable pre-market price levels and acknowledging uncertainty with explicit confidence ranges (±$5 on key estimates).
ChatGPT’s bullish lean (60% probability of increase) rested on the argument that most of the “information shock” was already priced into the gap down, and that with the VIX at 20 (elevated but not crisis-level), stabilisation was statistically more likely than a straight-line decline. It was the most conservative in its expected trading range at $192–$218.
5. Grok — The Sentiment-Aware Analyst
Grok provided a balanced four-page analysis that uniquely integrated social media sentiment from X (Twitter) and retail investor positioning data. It specifically cited posts calling AMZN a “dead stock” and criticisms of CEO Andy Jassy’s capex strategy, providing a distinctive lens on retail capitulation sentiment.
Grok’s technical analysis included a detailed indicator table (RSI, MACD, volume, support/resistance) and a day-by-day projected price table. Its 60/40 bearish lean reflected concern about a confirmed head-and-shoulders breakdown pattern and defensive market breadth indicators showing 45% advancers vs. 52.1% decliners.
6. Copilot — The Volatility Hawk
Copilot produced the shortest but most volatility-focused analysis, built around a concise driver table format. Its distinctive feature was projecting the widest potential price range of any chatbot ($185–$240), reflecting heightened sensitivity to tail risks from options gamma exposure and macro event uncertainty.
Copilot’s emphasis on options expiration mechanics (particularly the Feb 6 weekly OPEX) and negative gamma dynamics was well-articulated, though its range estimates appeared less precisely calibrated to the near-term horizon compared to its peers. Its 65/35 bearish split represented the second-strongest bearish conviction after Gemini.


Analytical Approaches Compared


Key Takeaways
The Bearish Majority: Four of six chatbots (67%) predicted Amazon would finish the five-day period lower than its opening price, with closing estimates ranging from $199 to $208. The consensus average closing price across all six models is approximately $203.70, representing a modest decline from the expected ~$204 open. The consensus average for the period low is approximately $193, suggesting all models expect at least one significant intraday test of the $190–$200 support zone.
Analytical Quality Spectrum: The quality and depth of analysis varied considerably. Gemini and Perplexity delivered institutional-grade research reports with sophisticated derivatives analysis and extensive source citation. Claude offered the best-calibrated probability framework with strong empirical grounding. ChatGPT prioritised clarity and accessibility. Grok brought unique social sentiment data. Copilot was the most concise but least precise in its range estimates.
The Limits of AI Forecasting: It is important to note that none of these AI chatbots are investment advisors, and their predictions should not be treated as financial advice. Stock price prediction over a five-day horizon is inherently challenging — even for the most sophisticated quantitative models — due to the reflexive, path-dependent nature of financial markets. The value of this exercise lies not in the accuracy of any single prediction, but in understanding how different AI systems approach complex, multi-factor analytical challenges under real-world conditions.


What to Watch This Week
As the trading week unfolds, readers can evaluate each chatbot’s forecast against actual market outcomes. Key markers to monitor include: whether the $190–$200 support zone holds during the initial sell-off; whether the stock can sustain any recovery above $208–$210; the impact of CPI data (if released despite the government shutdown); and overall tech sector rotation dynamics as the market continues to digest the era of $200 billion AI infrastructure bets.


License This Article


We are a leading AI-focused digital news platform, combining AI-generated reporting with human editorial oversight. By aggregating and synthesizing the latest developments in AI — spanning innovation, technology, ethics, policy and business — we deliver timely, accurate and thought-provoking content.