
AI Stock Predictions: 5 Top Chatbots Forecast Oracle Prices for Dec 2025
Disclaimer: This article is for informational and educational purposes only. The predictions and analyses presented herein were generated by AI systems and should not be construed as financial advice, investment recommendations, or solicitations to buy or sell any securities. Stock prices are inherently unpredictable, and all investments carry risk of loss. Past performance does not guarantee future results. Readers should consult qualified financial advisors before making any investment decisions. TheDayAfterAI News and its contributors do not accept liability for any losses arising from reliance on this content.
In an unprecedented experiment, TheDayAfterAI News tasked five of the world's leading AI chatbots with the same challenge: predict Oracle Corporation's (ORCL) stock price for the trading week of December 15-19, 2025. Following Oracle's mixed Q2 fiscal 2026 earnings report, which triggered a dramatic 13% selloff, we wanted to see how different AI systems would interpret identical market conditions and technical data.
The results reveal fascinating differences in analytical approaches, risk assessment, and confidence levels across ChatGPT, Perplexity, Gemini, Grok, and Claude. While all five platforms identified the stock as under pressure, their specific predictions and probability assessments varied considerably.


The Setup: Oracle Under Pressure
Oracle entered the week following a turbulent earnings announcement on December 10, 2025. Despite beating EPS estimates ($2.26 vs. $1.64 expected), the company missed revenue targets ($16.06B vs. $16.21B expected) and shocked investors with a 40% increase in capital expenditure guidance, from $35 billion to $50 billion annually. The market's reaction was swift and severe: shares dropped from above $220 to close Friday, December 12 at approximately $189.97.
Key concerns weighing on the stock included Oracle's massive debt load exceeding $99 billion, negative free cash flow of approximately $10 billion for the November quarter, and reports suggesting potential delays in OpenAI data centre projects. The week of December 15-19 also coincided with 'triple witching' on Friday, when stock options, index futures, and index options all expire simultaneously, adding another layer of potential volatility.


ChatGPT: The Cautious Optimist
ChatGPT's analysis characterised the stock as being in a 'post-earnings, high-volatility digesting phase' while noting that oversold momentum indicators suggested potential for a relief bounce. The platform emphasised the technical setup, particularly the RSI approaching oversold territory (near 30) and the significance of support around $185-$190.
Estimated Opening Price: $188-$191
Estimated Closing Price: $194
Weekly Range: $182-$205
Probability of Price Increase: 52%
Probability of Price Decrease: 48%
ChatGPT was the most bullish of the five platforms, assigning a slight edge to upward movement. The model noted that 'oversold bounce + post-earnings stabilisation slightly favors a bounce attempt' while acknowledging that 'guidance-driven repricing + macro/opex flows keep downside odds close.'


Perplexity: The Comprehensive Researcher
Perplexity delivered the most extensively sourced analysis, citing 40 distinct references including SEC filings, analyst reports, and real-time market data. The platform provided a notably bearish assessment, assigning the highest probability of decline among all chatbots tested.
Estimated Opening Price: $190
Estimated Closing Price: $182-$192 (central estimate: $187)
Weekly Range: $175-$205
Probability of Price Increase: 25-35%
Probability of Price Decrease: 55-65%
Perplexity's analysis emphasised the 'strong negative price shock with heavy volume and broken support' alongside 'bearish yet approaching-oversold momentum readings.' The platform notably provided the widest potential price range ($175-$205), reflecting significant uncertainty about near-term direction.


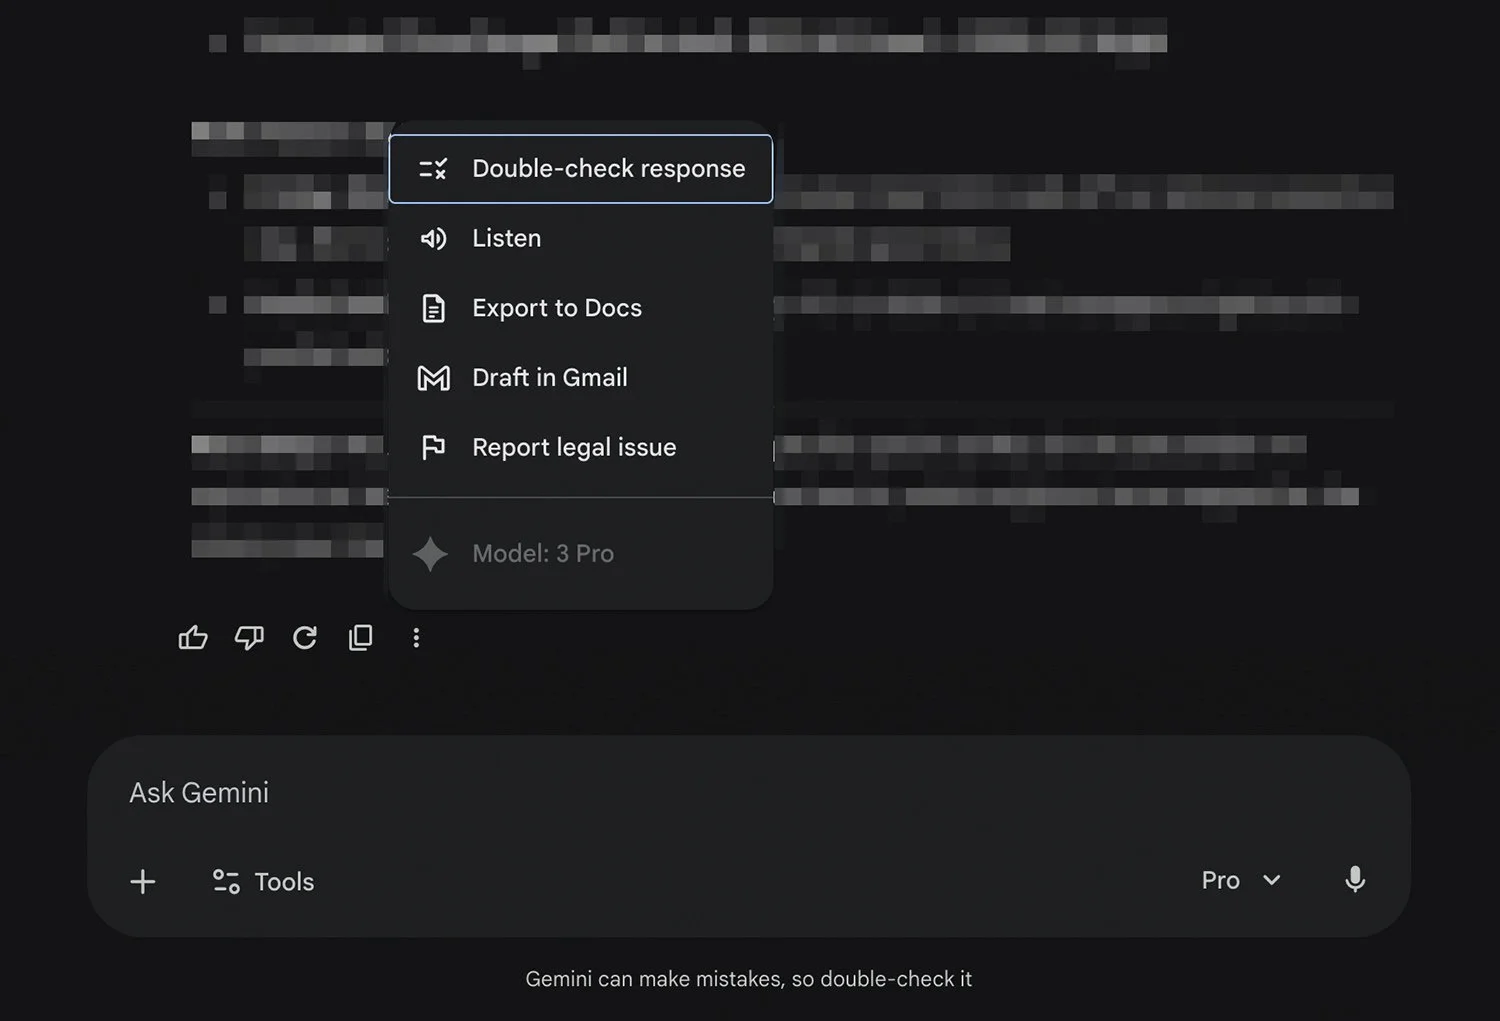
Gemini: The Technical Purist
Google's Gemini offered the most optimistic price target while maintaining a moderately bullish probability assessment. The analysis focused heavily on the oversold technical conditions as a precursor to mean reversion, suggesting a 'stabilisation week' was likely.
Estimated Opening Price: $189.50-$190.00
Estimated Closing Price: $194
Weekly Range: $186-$199
Probability of Price Increase: 60%
Probability of Price Decrease: 40%
Gemini described the situation as an 'AI Penalty Box', a colourful metaphor suggesting the market was punishing Oracle's 'spend money to make money' strategy despite the long-term AI growth narrative. The platform provided the narrowest trading range estimate ($186-$199), suggesting greater confidence in bounded price action.


Grok: The Sentiment Watcher
xAI's Grok distinguished itself through extensive analysis of social media sentiment, options flow patterns, and institutional positioning. The platform identified what it termed 'capitulation selling' in the post-earnings period while noting the potential for stabilisation as selling pressure exhausted.
Estimated Opening Price: $196.37
Estimated Closing Price: $192
Weekly Range: $185-$205
Probability of Price Increase: 35%
Probability of Price Decrease: 55%
Grok provided the highest opening price estimate ($196.37), potentially reflecting different data sources or timing in its market data capture. The platform emphasised 'sentiment-driven downside' as the primary risk while noting that 'oversold technicals and high analyst targets suggest limited further decline.'


Claude: The Risk Manager
Anthropic's Claude delivered a balanced analysis that weighed technical oversold conditions against structural concerns about Oracle's debt trajectory and cash flow dynamics. The platform assigned a moderately bearish outlook while acknowledging meaningful probability of a technical bounce.
Estimated Opening Price: $188-$190
Estimated Closing Price: $185-$193 (central estimate: $188)
Weekly Range: $182-$198
Probability of Price Increase: 35%
Probability of Price Decrease: 55%
Claude's analysis highlighted multiple risk factors including 'technical damage' from trading below all major moving averages, the 'hawkish Fed' environment pressuring growth stocks, and a 'broader rotation out of high-capex AI plays.' The platform specifically noted triple witching's 'historical tendency for volatility, often negative for recently weak stocks.'


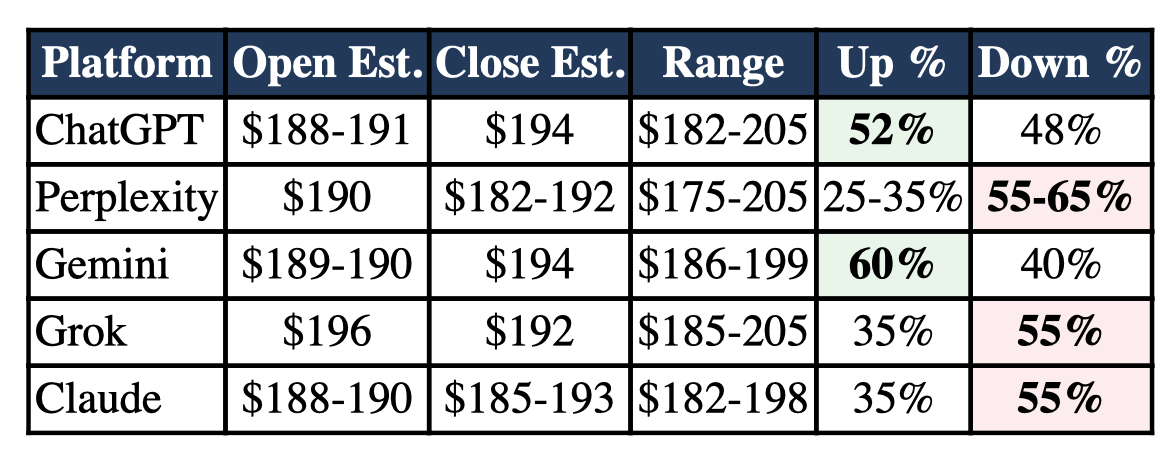
Summary Comparison
The following table summarises the key predictions from each AI platform:


Key Findings
Consensus Views
Despite differing methodologies and emphasis, all five platforms agreed on several fundamental points:
Support Zone: All platforms identified $185-$190 as critical near-term support, with secondary support around $175-$182 if that level failed.
Resistance Levels: $197-$200 was consistently identified as the first meaningful resistance, with the psychological $200 level serving as a key test for any recovery attempt.
Oversold Conditions: Every platform noted that technical indicators (particularly RSI approaching 30) suggested oversold conditions that could support a bounce, though none viewed this as a guarantee of upside.
Structural Headwinds: All analyses cited Oracle's debt burden, capital expenditure concerns, and the broader rotation away from high-capex AI plays as ongoing pressures.
Points of Divergence
The most significant disagreements centred on directional probability:
Bullish Camp: Gemini (60% up) and ChatGPT (52% up) weighted technical oversold conditions and potential stabilisation more heavily.
Bearish Camp: Perplexity (55-65% down), Grok (55% down), and Claude (55% down) emphasised structural concerns and trend continuation risks.
The spread between the most bullish (Gemini at 60% up) and most bearish (Perplexity at 55-65% down) probability assessments represents a substantial divergence in interpretation of identical market conditions.


Analytical Observations
Several patterns emerged from comparing these AI analyses:
Citation Depth Varies Significantly: Perplexity's 40-source analysis contrasted sharply with other platforms that provided fewer explicit references. This difference may reflect underlying model architectures rather than analytical rigour.
Technical vs. Fundamental Emphasis: Gemini and ChatGPT leaned more heavily on technical analysis and mean-reversion expectations, while Perplexity, Claude, and Grok balanced technical factors with greater weight on fundamental concerns.
Uncertainty Expression: Platforms differed in how they communicated uncertainty. Perplexity provided wider ranges and explicit probability bands, while Gemini offered more precise point estimates.
Event Risk Integration: All platforms noted triple witching on December 19, but assigned varying degrees of importance to this structural factor.


Implications for AI-Assisted Analysis
This experiment demonstrates both the potential and limitations of AI-powered financial analysis. On the positive side, each platform successfully integrated multiple data sources, identified relevant technical and fundamental factors, and produced coherent analytical narratives. The consistency of identified support and resistance levels suggests a reliable baseline capability.
However, the divergence in directional probability, ranging from 60% bullish to 65% bearish, highlights that AI systems can reach substantially different conclusions from identical inputs. This variation likely reflects differences in training data, model architecture, prompting interpretation, and the weighting of various analytical factors.
For practitioners, this suggests that AI analysis is most valuable when used as one input among many rather than as a definitive oracle. The consensus view across multiple platforms may carry more weight than any single prediction, while outlier views merit additional scrutiny to understand their underlying reasoning.


Conclusion
The 'Battle of the AI Oracles' reveals that leading AI platforms, when given identical analytical frameworks and market conditions, produce a range of predictions that cluster around certain consensus views while diverging meaningfully on directional probability. For Oracle's week of December 15-19, 2025, the weighted average across platforms suggests a slight bearish tilt (approximately 48% up vs. 52% down by simple averaging), with an expected trading range broadly between $182 and $202.
As AI tools become increasingly integrated into financial analysis workflows, experiments like this one help establish realistic expectations about their capabilities and limitations. These systems excel at synthesising large amounts of information quickly and identifying relevant factors, but, like human analysts, they can reach different conclusions from the same data.
License This Article
We are a leading AI-focused digital news platform, combining AI-generated reporting with human editorial oversight. By aggregating and synthesizing the latest developments in AI — spanning innovation, technology, ethics, policy and business — we deliver timely, accurate and thought-provoking content.